
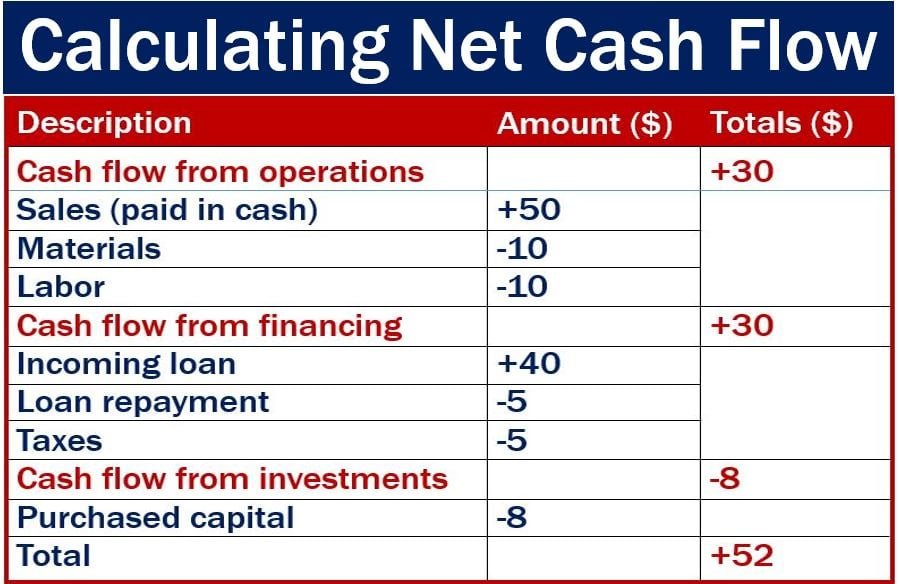
Cash Flow from Operating Activities:
Cash flow from operating activities is a crucial financial metric that indicates the amount of cash generated or used by a company’s core operations. It reflects the ability of a business to generate cash through its daily business activities, such as sales and expenses.
Positive cash flow from operating activities is generally considered favorable as it shows that a company can cover its day-to-day operational costs and potentially invest in growth opportunities. Negative cash flow, on the other hand, may indicate problems with profitability or liquidity.
Inventory Turnover Ratio:
The inventory turnover ratio measures how efficiently a company manages its inventory. It is calculated by dividing the cost of goods sold (COGS) by average inventory during a specific period. A high ratio suggests that inventory is being sold quickly, which reduces carrying costs and minimizes the risk of obsolescence.
A low ratio may indicate poor sales or excessive stock levels, tying up capital that could be utilized elsewhere. However, it’s important to consider industry norms when assessing this ratio since different sectors have varying inventory requirements.
Earnings per Share Growth Rate:
Earnings per share (EPS) growth rate reveals the percentage increase in earnings per share over time. It demonstrates how profitable a company has been in generating returns for shareholders.
Investors often seek companies with consistent EPS growth rates as they suggest improving profitability and potential future dividends or capital gains.
Price/Earnings to Growth Ratio (PEG):
The PEG ratio combines both price-to-earnings (P/E) ratio and earnings growth rate to assess whether a stock is undervalued or overvalued relative to its expected future earnings growth.
A PEG ratio below 1 indicates an undervalued stock compared to projected earnings growth, while above 1 suggests an overvalued stock. This metric helps investors gauge if they are paying too much for future earnings potential.
Dividend Payout Ratio:
The dividend payout ratio represents the proportion of net income distributed to shareholders as dividends. It is calculated by dividing dividends per share by earnings per share.
A low payout ratio implies the company retains more profits for reinvestment or future growth, while a high ratio suggests a larger portion of earnings is being returned to shareholders as dividends. Investors with different goals may prefer companies with varying payout ratios.
Return on Invested Capital (ROIC):
ROIC measures the return generated by a company’s invested capital, including both debt and equity. It assesses how effectively management utilizes capital to generate profits.
A higher ROIC indicates better utilization of available resources and stronger profitability. Comparing ROIC across competitors or industry benchmarks helps investors identify companies generating superior returns from their investments.
Debt-to-Equity Ratio:
The debt-to-equity ratio reflects the proportion of a company’s financing that comes from debt relative to equity. It is calculated by dividing total liabilities by shareholder’s equity.
A high debt-to-equity ratio can indicate financial risk since it shows heavy reliance on borrowed money, potentially leading to difficulty in meeting repayment obligations. A lower ratio suggests a more conservative financial structure.
Current Ratio:
The current ratio measures a company’s ability to meet short-term liabilities using its current assets. It is calculated by dividing current assets by current liabilities.
A higher current ratio usually indicates better liquidity and an improved capacity to pay off short-term obligations promptly. However, excessively high ratios may imply underutilization of assets or poor investment decisions.
Working Capital Turnover Ratio:
The working capital turnover ratio evaluates how efficiently working capital (current assets minus current liabilities) is used to generate sales revenue within a given period.
Higher turnover ratios suggest effective utilization of working capital and efficient operations in converting inventory into sales revenue. Lower ratios may indicate potential inefficiencies or problems in managing working capital effectively.
Gross Profit Margin:
Gross profit margin calculates the percentage of revenue remaining after deducting cost of goods sold (COGS). It measures a company’s ability to generate profits from its core operations.
A higher gross profit margin indicates greater profitability and the potential for covering operating expenses, debt obligations, and future growth investments. Comparing this metric across competitors or industry averages helps assess a company’s relative performance.
Net Profit Margin:
The net profit margin represents the percentage of revenue left after deducting all expenses, including taxes and interest. It provides insights into how efficiently a company manages its costs and generates profits.
A higher net profit margin implies better cost control, pricing power, and overall operational efficiency. This ratio is useful for comparing companies across different industries or assessing changes in profitability over time.
Return on Assets (ROA):
ROA measures how effectively a company utilizes its assets to generate profits. It is calculated by dividing net income by average total assets during a specific period.
Higher ROAs suggest efficient asset utilization and effective management decision-making. Comparing ROAs among companies in the same industry helps identify those generating more income per dollar invested in assets.
Asset Turnover Ratio:
The asset turnover ratio evaluates how efficiently a company uses its assets to generate sales revenue. It is calculated by dividing total sales by average total assets during a specific period.
Higher ratios indicate that a firm can generate more sales using fewer assets, demonstrating operational efficiency. Lower ratios may suggest problems with inventory management or underutilization of fixed assets.
Free Cash Flow Yield:
Free cash flow yield measures the amount of free cash flow generated relative to market capitalization—the value of outstanding shares in the stock market at current prices—expressed as a percentage.
Investors often consider high free cash flow yields as favorable since it suggests ample liquidity available for reinvestment or returning capital to shareholders through dividends or share buybacks.
Price/Sales Ratio:
The price/sales ratio compares a company’s market capitalization with its annual sales revenue per share (price divided by sales per share).
This ratio helps investors evaluate a company’s valuation relative to its revenue-generating capacity without considering profitability. Lower ratios may indicate undervaluation, while higher ratios suggest overvaluation.
Book Value per Share:
Book value per share represents the net asset value of a company divided by the number of outstanding shares. It provides insight into the intrinsic worth of each share if all assets were liquidated and liabilities paid off.
Comparing book value per share with the market price can help identify undervalued or overvalued stocks, although it does not reflect intangible assets or future growth potential.
Earnings Quality Analysis:
Earnings quality analysis assesses how reliable and sustainable a company’s reported earnings are. It examines factors such as revenue recognition practices, accounting methods, and management’s adherence to accounting standards.
Investors seek companies with high earnings quality since it reduces the risk of financial restatements or misrepresentations that could adversely affect stock prices or investor confidence.
Sustainable Growth Rate Calculation:
The sustainable growth rate calculation estimates the maximum rate at which a company can grow its sales revenue while maintaining its current financial structure (equity-to-assets ratio) and profitability (return on equity).
This metric helps assess whether a firm is relying excessively on external financing for growth or if it has sufficient internal resources to support expansion plans sustainably.
DuPont Analysis of Return on Equity (ROE):
DuPont analysis breaks down return on equity into three components: profit margin, asset turnover, and financial leverage. By analyzing these elements individually, investors gain insights into what drives changes in ROE over time.
Understanding these components allows investors to differentiate between companies with similar overall ROEs but different underlying drivers of profitability and efficiency.
Capital Expenditure Analysis:
Capital expenditure analysis evaluates a company’s investments in long-term assets necessary for business operations. It assesses management decisions regarding capital allocation and their impact on future cash flows and profitability.
Examining historical trends in capital expenditure enables investors to gauge a company’s growth prospects, financial stability, and commitment to maintaining or expanding its competitive position.
Cash Conversion Cycle:
The cash conversion cycle measures the time it takes for a company to convert its investments in inventory into sales revenue and then into cash received from customers. It is calculated by adding the days inventory outstanding (DIO), days sales outstanding (DSO), and days payable outstanding (DPO).
A shorter cash conversion cycle suggests efficient working capital management and faster cash flows, improving liquidity and reducing reliance on external financing.
Equity Multiplier:
The equity multiplier assesses how much debt a company uses to finance its assets relative to shareholder equity. It is calculated by dividing total assets by total equity.
A higher multiplier implies greater leverage or borrowing, potentially amplifying returns but also increasing financial risk. Comparing this ratio across similar companies helps evaluate their respective capital structures.
Financial Leverage Index:
The financial leverage index measures a company’s ability to cover interest payments using operating income before interest and taxes (EBIT). It indicates the extent of risk associated with servicing debt obligations.
Higher leverage ratios suggest increased financial risk since interest expense consumes a larger portion of EBIT. Lower ratios indicate better capacity for managing debt payments out of operating profits.
Interest Coverage Ratio:
The interest coverage ratio determines a company’s ability to service its interest expenses using operating income before interest and taxes (EBIT). It indicates whether earnings are sufficient to meet future fixed payment obligations related to debt.
Higher ratios imply lower default risk as there is more coverage available for meeting interest payments. Lower ratios may signal potential difficulties in meeting existing obligations without additional financing or improved profitability.
Net Working Capital:
Net working capital represents the difference between current assets and current liabilities on a balance sheet. It shows the amount of short-term funds available after settling immediate obligations.
Positive net working capital provides cushioning during economic downturns or unexpected events, while negative net working capital may indicate insufficient liquidity or potential difficulties in meeting short-term obligations.
Profitability Index:
The profitability index measures the relationship between present value of cash inflows and outflows associated with an investment project. It helps assess whether a project is financially viable or able to generate positive net present value (NPV).
A profitability index greater than 1 suggests that the project will generate positive returns, while values less than 1 indicate potential losses. This metric aids decision-making regarding capital allocation for future projects.
Residual Income Valuation:
Residual income valuation calculates the worth of a company’s equity by assessing its ability to generate excess returns above the cost of capital. It considers net income minus a charge for equity capital employed.
Comparing residual income valuations across companies assists investors in identifying firms creating additional shareholder value beyond what is expected based on their financial structure and risk profiles.
Risk-Adjusted Return on Capital (RAROC):
RAROC measures the return realized from an investment relative to its risk level, considering both expected return and downside risk. It helps evaluate whether an investment provides adequate compensation for risks taken.
Comparing RAROC across investments allows investors to select those with higher returns per unit of risk or determine if they are being adequately compensated for bearing additional risks associated with specific assets or projects.
Stock Repurchase Analysis:
Stock repurchase analysis evaluates a company’s decision to buy back its own shares from the market. It examines factors such as price-to-earnings ratio, impact on earnings per share, and effects on shareholder value.
Investors may view stock repurchases positively since they signal confidence in future prospects or seek opportunities where repurchases create shareholder value by reducing outstanding shares and increasing ownership stakes.
In conclusion, understanding these financial metrics can assist investors in making informed decisions about individual stocks or overall portfolio management. However, it is essential to remember that no single metric should be considered in isolation but rather as part of a comprehensive analysis tailored to individual investment objectives and risk tolerance.